Below is a complete sample engagement for “Cedar Ridge Heating & Air” — a fictional demonstration company built on synthetic data that mirrors a typical $2.2M residential HVAC contractor. The company isn't real. The methods, the math, and the report you'd receive are exactly real.
I built it this way on purpose: you get to judge the work itself before spending a dollar, and my clients' numbers stay private — which should tell you how yours will be treated.
What the analysis of 2,686 jobs found
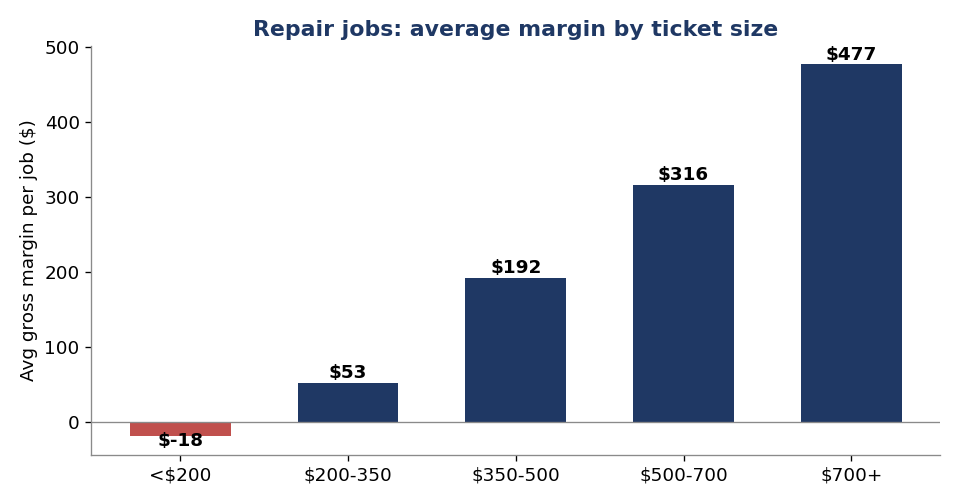
42% of repair calls earning ~$23 each → diagnostic-fee restructure+$24,400/yr
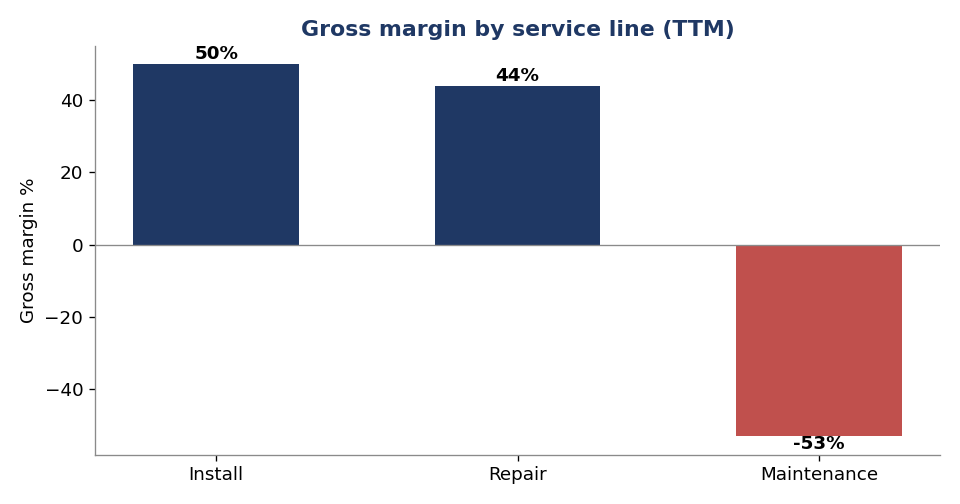
$149 maintenance plan costing $190 to deliver → repriced+$30,900/yr
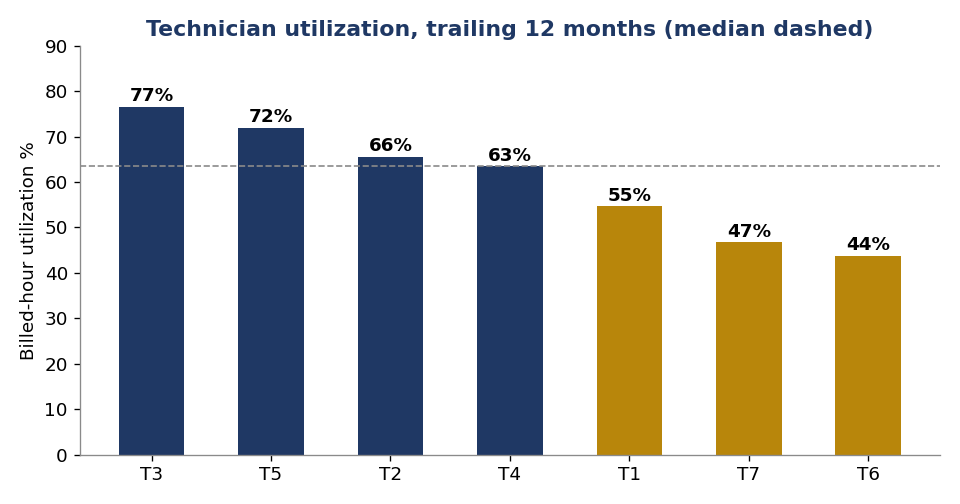
Utilization spread of 44–77% → zone dispatching+$17,500/yr
Total identified — 16x the fixed fee$72,700/yr
Download the full sample report (PDF)
One-page case study (PDF)
Free self-assessment worksheet (PDF)
Demonstration engagement. Cedar Ridge Heating & Air is a fictional composite; all figures derive from a synthetic dataset built to mirror a typical $2M residential HVAC contractor, analyzed with the same methods used in live engagements.